
Peak is one constraint
Our two-level model shows that equal peak demands can have very different RMS demands. A 200 Nm label alone cannot establish cooling, speed or burst capability. Compare the calculated loads.
200 Nm class · engineering load screen
Compare peak and RMS joint loads with a 200 Nm target. Review assumptions and prepare an RFQ; product ratings require confirmation.
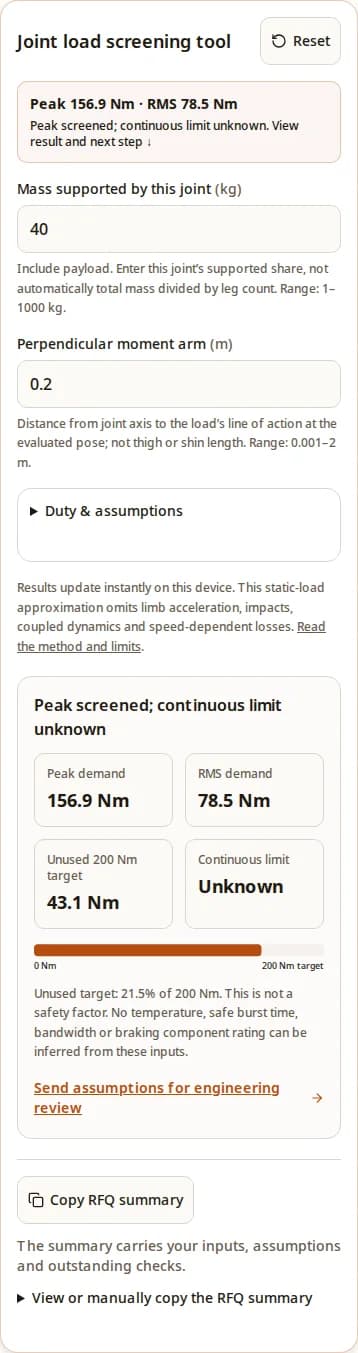
Include payload. Enter this joint’s supported share, not automatically total mass divided by leg count. Range: 1–1000 kg.
Distance from joint axis to the load’s line of action at the evaluated pose; not thigh or shin length. Range: 0.001–2 m.
Defaults: multiplier 2×, loaded duty 25%, rest torque 0 Nm, continuous limit unknown. Expand to change these assumptions.
Default 2 is an illustrative assumption. Replace with a trajectory-derived factor; it does not certify impact loads. Range: 1–10 ×.
Fraction of the repeating cycle at the multiplied load. Burst seconds must be checked separately. Range: 0.1–100 %.
Use magnitude. Zero assumes unloaded recovery; holding torque increases RMS demand. Range: 0–10000 Nm.
Leave blank if unknown. Enter only a supplier-confirmed value for your cooling, speed and ambient conditions. Range: 0.1–10000 Nm.
Results update instantly on this device. This static-load approximation omits limb acceleration, impacts, coupled dynamics and speed-dependent losses. Read the method and limits.
Peak demand
156.9 Nm
RMS demand
78.5 Nm
Unused 200 Nm target
43.1 Nm
Continuous limit
Unknown
Unused target: 21.5% of 200 Nm. This is not a safety factor. No temperature, safe burst time, bandwidth or braking component rating can be inferred from these inputs.
Send assumptions for engineering reviewOur two-level model shows that equal peak demands can have very different RMS demands. A 200 Nm label alone cannot establish cooling, speed or burst capability. Compare the calculated loads.
Lower gearing reduces the ratio contribution to reflected motor inertia, all else equal. Actual impact and control behavior require system evidence. MIT research explains the design tradeoffs.
Confirm torque at speed, cooling conditions and electrical limits for one revision. Motor relationships and energy recovery explain why a single torque number is insufficient.
The tool evaluates a gravitational load at one chosen pose. You choose the supported mass m, perpendicular arm r and load multiplier k. It does not estimate contact sharing from robot type.
τ_loaded = m × 9.80665 × r × k
τ_peak = max(τ_loaded, |τ_rest|)
τ_RMS = √[d × τ_loaded² + (1 − d) × τ_rest²]
Here d is the peak-duty percentage divided by 100; rest torque is entered as a nonnegative magnitude. Maximum demand includes each interval with nonzero duration; at 100% loaded duty, rest torque is ignored. The displayed reserve uses 200 Nm as its denominator. Comparisons use unrounded values; rounding is for display only.
This is our explicit screening approximation, not a published humanoid sizing rule. Independent inertial torques, link masses, joint coupling, friction, acceleration and impact compliance need a multibody model or measurement. Constant torque-to-current behavior makes RMS useful as an initial loss proxy; speed and temperature effects still need a separate test.
Published and reviewed . No revision-specific product datasheet or dynamometer record is attached to this page. General references below do not verify this supplier’s product ratings.
Published by QDD Actuator. This engineering worksheet documents software calculations; it does not claim independent hardware testing. Review due by 1 May 2027, or sooner when the method, cited sources or configuration evidence changes.
| Parameter | Current status | Required evidence |
|---|---|---|
| Peak output torque | 200 Nm screening target; not a verified rating | Torque-speed trace, peak duration, initial temperature and current definition |
| Continuous torque / temperature | Unknown; optional tool limit is user supplied | Thermal equilibrium test at stated speed, ambient and mounting conditions |
| Ratio / rotor inertia | Unknown for the proposed unit | Revision-specific ratio N and rotor inertia J; reflected motor inertia = J × N² |
| Specific torque / torque density | Unknown; neither configuration torque nor complete assembly mass is verified | Divide verified peak or continuous torque at stated conditions by complete assembly mass (Nm/kg); do not use the 200 Nm screening target as a rating |
| Backdrive / bandwidth | Unknown | Measured curves with temperature, drive state, load and control conditions |
| Mass / dimensions / hollow bore | Unknown | Assembly mass and controlled CAD drawing, including driver, cables and brake |
| Bus voltage / speed / phase current | Unknown | Winding and controller limits; continuous and transient bus limits |
| Encoder / communications / brake | Configuration to be agreed | Interface manual, timing, calibration method and power-loss behavior |
| Peak duty | Rest torque | RMS demand | Interpretation |
|---|---|---|---|
| 10% | 0 Nm | 63.2 Nm | Short loaded fraction; burst seconds still unknown |
| 25% | 0 Nm | 100.0 Nm | One-quarter duty is not one-quarter RMS torque |
| 50% | 0 Nm | 141.4 Nm | Higher sustained demand at the same peak |
| 100% | 0 Nm (unused) | 200.0 Nm | Continuous demand equals peak; needs a continuous rating |
| 25% | 60 Nm | 112.7 Nm | Holding torque raises the cycle RMS |
These values follow the displayed equation, not measured thermal tests. Cooling performance, iron losses, friction, temperature-dependent resistance and the time scale of each burst determine the actual temperature. Obtain thermal impedance or a trajectory-based test rather than assuming a fixed safe number of seconds.
Torque demand sets motor current for a fixed torque constant; bus voltage primarily changes speed headroom. Battery and motor phase currents differ. Motor-data reference.
Braking can return energy to the DC bus. Check battery acceptance, controller limits and buffering or dissipation together. Energy-recovery reference. No braking resistor, capacitor or bus voltage is selected by this tool.
| Decision | Inputs needed | Next step |
|---|---|---|
| Torque at joint speed | Torque-speed trace; winding constants; controller voltage/current limits | Overlay required operating points on the measured envelope |
| DC bus tolerance | Maximum charged battery voltage; transient and trip limits | Review operating and transient margin with controller supplier |
| Regenerative energy | Braking torque × speed over time; simultaneous axes; BMS charge acceptance | Integrate energy and assess the actual recovery path |
| Buffer / brake chopper | Permitted bus rise; event energy; repetition and cooling | Select and validate components using pulse and thermal ratings |
| Communications | Required modes, sample rate, synchronization and fault recovery | Test the controller with the actual host and cable topology |
This is a qualitative engineering comparison, not a measured competitor ranking. Compare complete assemblies at the same operating point. The low-ratio actuation rationale comes from MIT’s research; no universal shock-survival or backdrive value follows from the architecture name.
| Route | Reason to investigate | Tradeoff / verification |
|---|---|---|
| Low-ratio rotary QDD | Dynamic contact and a direct rotary load path | Motor size, friction, cooling and reflected inertia need measurement |
| Higher-ratio geared rotary | Compact motor with larger torque multiplication | Evaluate backlash, compliance, reflected inertia and reverse efficiency |
| Direct-drive rotary | Avoid reduction gearing where packaging permits | Compare complete motor mass, cooling and torque at required speed |
| Linear actuator + linkage | Remote mass placement or a narrow joint envelope | Torque changes with moment arm; inspect singularities and bearing loads |
| Brake or counterbalance + actuator | Sustained gravity load or power-loss holding | Assess added mass, release control, stop energy and maintenance |
Avoid choosing this torque class solely from body mass, a torque-density headline, or a claimed gear ratio. For precision positioning, suspended loads or narrow limbs, begin with accuracy, holding and packaging requirements; a different architecture may fit better. Include cooling hardware, power electronics, brake, wiring and validation time in the cost comparison.
Synthetic examples, not robot trials. Each starts with 40 kg supported mass and multiplier 2; continuous limit remains unknown. Load one into the same tool to inspect the inputs.
Arm 0.2 m · duty 25% · rest 0 Nm
156.9 Nm peak and 78.5 Nm RMS. The peak target is not exceeded; continuous capability is still unknown.
Arm 0.3 m · duty 25% · rest 0 Nm
235.4 Nm peak and 117.7 Nm RMS. The same mass now exceeds the 200 Nm target; reconsider geometry or a higher peak class.
Arm 0.2 m · duty 50% · rest 60 Nm
156.9 Nm peak and 118.8 Nm RMS. Unchanged peak demand hides a much larger sustained load; request a matching thermal test.
| Risk | Verification | Mitigation / alternative |
|---|---|---|
| Load-model mismatch | Simulate or measure joint torque and speed through the full task | Revise geometry, transmission or torque class before hardware approval |
| Repeated-burst overheating | Test actual cycle, ambient and mounting until temperatures stabilize | Reduce sustained load or validate improved cooling; do not assume a duty label proves compliance |
| Power-loss motion | Evaluate controlled stop and holding with the full gravity load | Specify an appropriate brake or counterbalance and validate its behavior |
| Bus overvoltage | Observe bus behavior with worst-case deceleration and restricted battery charging | Validate a complete energy-absorption or dissipation path |
| Shock / bearing damage | Assess impact and radial/axial/moment loads at the mounting interface | Change load path, bearings or compliance; low ratio alone proves no survival rating |
| Control mismatch | Check torque calibration, encoder offsets, latency and fault recovery | Tune and validate on a restrained test rig before dynamic trials |
| Budget / delivery mismatch | Quote the full configuration plus cooling, integration and acceptance tests | Stage prototype purchase; agree dates and commercial terms in writing |
Send the current summary with a torque-speed-time trace, burst and rest seconds, ambient and cooling details, CAD envelope, joint bearing loads, power bus limits and interface requirements. Include quantity, destination and project schedule. If the load profile is unknown, send geometry, payload and a motion description as the minimum starting point.
Ask for the proposed model and revision, tested continuous and peak envelopes, traceable acceptance data, controlled drawings, price, delivery and warranty terms. Availability and commercial terms require a current written quotation.
Inquiry Email
Include robot type, joint location, torque/speed/voltage targets, quantity, and destination.
Instant Chat
WhatsApp Engineering Support
Send QDD actuator specs, STEP files, or actuator references for engineering review.
Here 200 Nm is a peak screening target. Continuous torque and allowable peak duration are unknown until a specific actuator, mounting condition and test report are confirmed.
Total mass alone cannot answer this. Enter the supported share and perpendicular lever arm at the critical pose, then check the full torque-speed trajectory, acceleration and contact loads.
Enter the mass whose load is supported through the evaluated joint, including payload. Do not divide total robot mass by the number of legs unless your contact model justifies that load distribution.
No. The moment arm is the shortest perpendicular distance from the joint axis to the force line of action. It changes with pose and force direction even when segment length stays fixed.
No. The default multiplier is illustrative. Derive the evaluated load from simulation or force measurements; this simple gravitational screen omits independent inertial terms and collision dynamics.
For the idealized constant torque-to-current relationship, mean squared torque is a proxy for copper-loss demand. The two-level RMS equation is reproducible, but it does not predict winding temperature or account for speed-dependent losses.
No. One second in every four and ten seconds in every forty share the same duty fraction but have different transient temperatures. Supply burst seconds, rest seconds and initial temperature for supplier review.
Leave the optional limit blank. You still receive peak and RMS demand, while the result remains incomplete. Send the summary and mounting details to request a documented continuous rating.
No. It only means the two entered torque thresholds are not exceeded. Speed, cooling, burst duration, shock loads, bearing loads, power-loss behavior and controls remain open checks.
For a fixed motor and operating condition, torque demand primarily sets torque-producing current. Higher bus voltage mainly affects speed headroom; battery current and phase current are different quantities. See the motor-data reference.
No. Supply the braking energy, repetition rate, maximum battery voltage, permitted bus rise and controller limits. A fixed resistor or capacitor recommendation without those inputs would be incomplete.
No. Motor inertia reflected through a ratio N scales as J_motor × N², but total behavior also depends on rotor design, friction, cogging, seals, drive state and control. Ask for a measured output backdrive curve.
No. They are synthetic calculations using explicit assumptions, intended to show sensitivity to lever arm, duty and holding load. They are not field trials or performance guarantees.
Do not assume that capability from QDD gearing. Require a separately validated holding and controlled-stop arrangement appropriate to the machine, including a brake where required by the design.
Request revision-specific CAD, test data, a quotation, delivery timing and warranty terms for the proposed configuration. This page does not establish current stock, a price or a guaranteed delivery date.
Send torque and speed versus time, burst and rest durations, mass and geometry assumptions, cooling and ambient conditions, bus and interface requirements, mounting loads, quantity and destination.
Source links checked on . These references support general principles. Our load equations and synthetic examples are disclosed above; product-specific performance is unconfirmed. No production-dynamometer audit is claimed.
Research on low-ratio actuation and impact interaction; not validation of a QDD Actuator product. DOI: 10.1109/TRO.2016.2640183.
General torque/current and speed/voltage relationships; not a winding or controller specification for this torque class.
General DC-bus energy recovery principles; component selection still requires the actual system limits.